Guide to Audit Logging for Cloud Native Companies
A deep dive into best practices for what is audit logging with best practices for cloud native companies.
Article Contents
Chances are if you’re reading this, you’re probably close to somebody like a system administrator or a developer who's been asked to investigate audit logging for your organization. In some cases, you’ll be asked by auditors to show a strict record of what actions have taken place on a machine. In others, somebody from the cybersecurity team found something suspicious and you might have been asked what systems of records do we have on what an individual might have done. The answer to this is a strong audit logging strategy.
In the past we were able to ssh into monolith applications and quickly check AuditD or /var/log and get to see some of the relevant log data for issues we’re seeing. As more and more architectures evolve to be cloud native, what we’re seeing is that the added complexity of these makes it much more difficult to know if the right people are able to access the right information.
In this article we’ll be covering in detail how you can approach audit logging for organizations that are starting as or migrating to a cloud native approach to infrastructure. Let's start with what Audit Logging is.
What is audit logging?
To define audit logging, we first have to define what we audit. Let’s call any action that happens on a system an event. The system keeps track of these events in order to keep a record of what has happened on the system. An audit log can be thought of as an aggregation of these events, specifically with an eye towards information that could be helpful in identifying the following:
- What specific event was transpired?
- Who did the aforementioned action?
- When did they do it?
- Where did these commands take place?
It’s important not to confuse audit logs with system logs. The differences here lie in their purpose. System logs are fantastic for debugging and trying to figure out how we might try to learn about a system. They may have multiple logging levels and give error messages about why something might have happened.
Examples of system logs:
- Errors & error messages
- Application-specific context
- Debugging the logic and flow of code
Audit logs function more to define who is accessing the system, what they’re doing, and where. Audit logs are great for proving compliance with regulations as well as being able to manage the risk that comes with the access you’ve given your developers. Audit logs give the records of what activity is taking place so you can look closer into suspicious activity. Both records of log events are important but they solve different problems.
Examples of the types of activities that audit logs would track:
- Administrative access
- Data access and modification
- User denials or login failures
- System-wide changes
In order to meet the above points, log entries should contain the following information:
Examples may include:
- UIDs
- User Id
- Date and timestamps
- IP address
- Activity, legitimate and rejected
- Changes to user privileges, ID numbers or configuration settings
- Authentication attempts
- Network information related to system access (port, protocol)
- Any alerts raised
- Transactions, data sharing or external connections made
- Access of secure info or Personally Identifiable Information (PII)
How audit logging works
Audit logging works by defining a set of key fields you want to start tracking and making sure that the applications you write log that information. You can use the above list as an example of things you’d like to log. Once the applications log that information, you can use a script/agent to start the forwarding of those logs to a centralized location. This can happen in real time, or it can pull directly from log files.
As an example of the above, I’ve posted below an example of some of both Auditd and Teleport’s audit logs.
Auditd Logs:
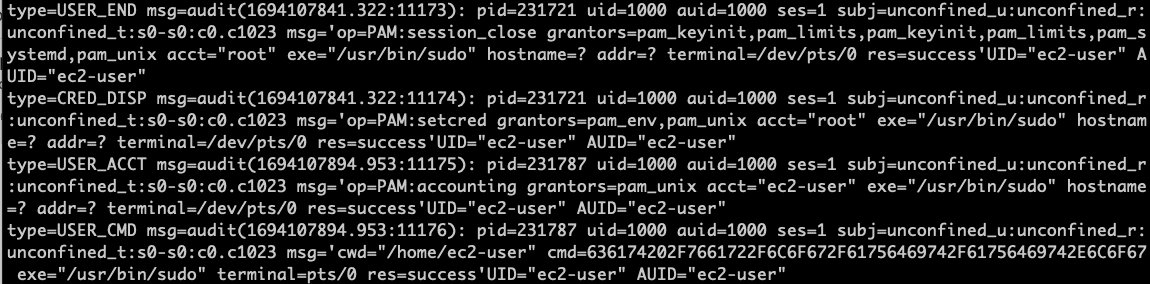
In the Auditd logs we see the type of action that is taken. Let’s take for example: USER_CMD. We have the “type” which gives us the type of command we’re running, the process ID of the command run, the message of what they ran and how they tried to run it. We also have the UID of the user who ran the command so we can attribute actions back to the people running commands. If you need to search you could use auditctl as well to get more specific information.
Similarly in Teleport’s audit log we map similar attributions.
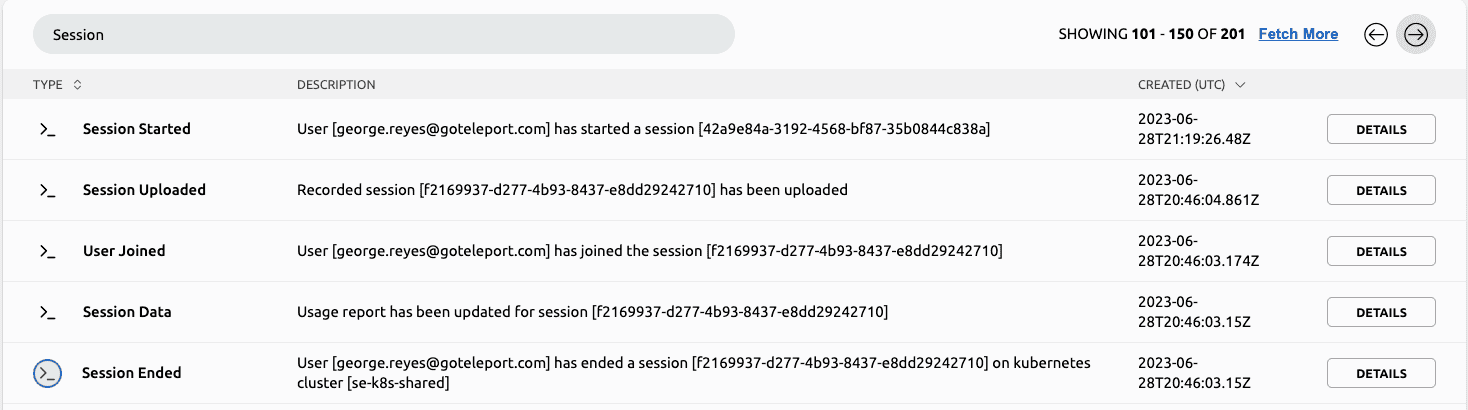
In the above picture, because Teleport centralizes access to infrastructure we have a single place we can go that allows you to see all of your logs. From here, I can request specific event types (like Sessions as you see in the search at the top), allowing me to quickly get to the context of what I wanted to search for. Included with this initial metadata is the time this request happened, who took the action, what type of event was recorded, and what the context of that event was (whether I started a session or finished one).
Going deeper and clicking on details allows me to see the template that Teleport uses. Let’s take a look at the “User Joined” information.
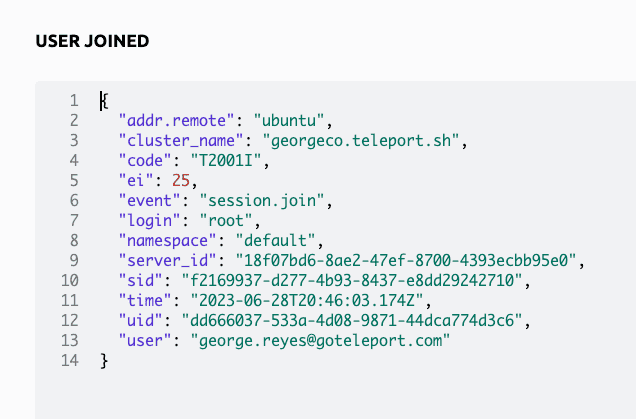
I can see the name of the cluster, the uid of the user, as well as the identifying markers of when they joined. This kind of information makes it really easy to hand off to an auditor who is looking to see if an organization has the right controls in place to be able to meet compliance needs.
Benefits of audit logging
Audit logging offers your business a huge number of benefits. Examples from our research include but are not limited to:
- Demonstrating compliance
- Troubleshooting system issues
- Chain of evidence or custody
- Insight and optimization for security and audit procedures
- Reconstructing security breaches
- Business process tracking
- Providing legal evidence
Let’s dive deeper into a few of these.
Demonstrating compliance
With so many different regulatory requirements and certifications (HIPAA, FedRAMP, ISO 27001, SOC, PCI DSS etc.) it can be impossible to meet the standards set without a strong audit logging strategy in place. These standards often require special guardrails against sensitive data, and require logging specific security events. Demonstrating compliance is one of the core use cases we see throughout our customer base. For example, some organizations may need to meet SOC 2 Type II Controls in order to work with certain customers. Others may need to contend with HIPAA or FedRAMP compliance. A core part of meeting these regulations is audit logging. Having the flexibility to show the exact actions that were taken, and by whom, allows you to quickly show auditors that your organization is compliant with those regulations.
We’ve gone a step further to show what features Teleport offers in relation to some of this regulation to make it easier for our customers. Whether it is SOC 2 Type II or FedRAMP. These are also a helpful starting point if you’re building your own audit logging infrastructure since you’ll want to make sure you’re tracking the right things to meet those compliance requirements.
Insight and optimization for security and audit procedures
Regularly reviewing audit logs allows you to see and establish patterns that your users are performing. These kinds of insights are incredibly valuable since they allow you to see if your procedures are being followed, and may allow you to glean insights as to whether there might be improvements that your team can make that render the organization more efficient. Examples that we’ve seen are:
- Seeing access to a core system taking 10 steps, and once identified streamlining access to only two steps using a script for automation to reduce toil, saving your organization time and money.
- Seeing that people are improperly accessing a system, and locking it down in order to be compliant with regulation.
- Alternatively, you may see that you aren’t getting the information you need from your audit logs and so you’ll need to work with your organization to improve the quality of your logging in order to glean better insights.
Best practices and challenges for audit logging
Prior to the explosion of container-based infrastructure, it was fairly easy to run a tmux command, and ssh into all of your local servers to see the logs across multiple windows, and even create a script to forward them to a central location. Applications ran as monoliths and so establishing adequate log management was fairly simple. This allowed you to quickly aggregate and create your own audit log, as long as you spent the time to make sure you were forwarding the correct file and that you didn’t run out of disk space. If you couldn’t find the right log in that aggregator, you could go log into the machine where the monolith was running and look them up by hand.
With the advent of cloud computing we’re seeing increasingly disparate systems, each with their own logging format requiring log records to be forwarded quickly due to the ephemeral nature of their environments. This requires us to handle a larger scale of logs, as well as apply more complex logic to each since they may each be in different formats, or even subtle differences between date formats that require extra processing. This can be further compounded by organizations taking a multi cloud approach as now there are different locations where those logs can be found and also need to be aggregated into a complete audit log. Cloud poses a new challenge of also requiring an audit log for the control panel; most clouds have a built-in audit log; for example, AWS CloudTrail.
For example, in k8s or IoT use cases, you’re likely to be running a high number of containers across a great many operating systems. It's not uncommon to see hundreds or in some cases thousands of containers spun up and down over the course of a day. Due to the number of services generating logs, they also have a high cardinality associated with them. This can make it exceptionally difficult to sort through logs, and is an order of magnitude higher than what we used to deal with when we worked with monoliths.
To resolve some of these issues, we’ve compiled some of the best practices across our customer base in order to circumvent some of these challenges.
- Have a centralized place to view logs
- While information is coming from many different cloud providers ( AWS/GCP/Azure) and on-prem operating systems (Windows, Linux, etc.), having one place where everybody can go to view it greatly simplifies the overhead of needing to find specific information.
- JSON is a really popular format to store logs in as it allows you to quickly format fields that are emitted, and there are many open source tools that use JSON as a basis to emit logs. Fluentd is a great tool for shipping logs to a central system.
- Decide on a schema upfront
- Given that you’ll be rolling this out to many different services it helps to define a common schema and format up front so you can use audit logs that are generated. JSON is a really popular format in this regard and many logging libraries support logging out to JSON by default.
- Consider logging only what you really need
- While it may be tempting to log everything possible at a debug level, this can add up in costs. Consider logging core information needed for compliance and having other information behind a feature flag that can be turned on when needed.
- Decide how long you need to retain information
- For HIPPA you may need to keep logs for up to 6 years
- SOX controls may require you to keep logs up to 7 years
- It’s worth examining the kinds of compliance that are specific to your organization and make a reasonable determination as to how long you need to keep your logs and how you access them.
- Prevent unauthorized access to audit logs
- Make sure you have a way to authenticate and authorize users who need to have access to logs.
- Audit logs are only as functional as they are secured. If they are tampered with, then that compromises their usefulness. Make sure to regularly audit the user accounts with access to the logs so that only people with the right permissions are allowed to interact with the logs.
When building our audit log functionality, we recognized that while we needed to build something good for our customers, in an effort to follow the above best practices, we also needed to establish a good SIEM integration allowing export to a centralized data lake/warehouse like Snowflake/Datadog/Splunk. This allows individuals to collect logs without forcing them to go to multiple different systems to see them.
Nuances and challenges of logging in different cloud native applications
As outlined above, there are few challenges for a comprehensive auditing strategy for cloud environments. For example, when using AWS, you’re signing up for the ‘shared responsibility model’, meaning you need to take responsibility for the data you’ve generated. This means that while AWS protects the physical access of services, you’re responsible for setting up the firewall and correctly configuring access to the servers and services.
In IoT contexts we have the following additional considerations:
- Space is at a premium on these devices — due to that, they emit smaller batches of logs very frequently. This can put a lot of pressure on systems that aren’t scaled to meet those demands in a globally distributed context.
- Due to the fact that many devices may be doing the same action at the same time, IoT devices have a high cardinality. Make sure to embed information that allows you to meaningfully differentiate devices from each other is key to a functional IoT logging strategy.
- We cover some additional considerations in our article “Remotely Access IoT Devices”.
In Kubernetes contexts we have the following additional considerations:
- It can take a while to propagate logging levels — make sure you’re logging what you need, but keep in mind that it can take a while to escalate logs depending on the complexity of what you’re logging.
- It’s worth checking our article dedicated to best practices around Kubernetes audit logging.
- As teams move from on-prem to cloud, they might fall back to old practices such using SSH to access their Docker images, when there could be a better approach such as to SSH into Docker Container or Use Docker Exec.
How to evaluate cloud-native audit logging solutions
There are a lot of different solutions out there. Whether buying a solution or building your own, keep the following considerations in mind when designing requirements.
- How easy is it to parse and query
- When looking for information, especially during an outage, it is critical to be able to get to the most important things quickly. Is the query language easy, and can your users quickly access the API with little to no enablement?
- Completeness
- Do all of your logs make it? Are they in the order you expect, and can you verify that they made it over in the form you expected?
- Consistency
- Can you validate that your logs are consistently making it over? Is it easy to debug if a service or system is not logging but should be? Have you replicated the data globally for quick access, or is it stored in a single region?
- Access control
- Logs may contain sensitive information, so it’s essential to be able to tightly control who can view what logs, and in what situations people should have access to some logs.
- Can I easily retrieve log data over an API?
- Open source
- Can you audit their codebase? Is there a community contributing and can a third party verify that the software you’re using is secure?
When building audit logging into Teleport, we kept the above in mind. Since Teleport functions as a central point of access into people's infrastructure, it made sense that those users wanted strict audit trails on what happens on those systems. Given our unique position in granting access, we make it trivial to audit that access without any additional overhead from your developers. We also offer BPF support to transform SSH Sessions to Structured Event allowing you to get much more granular about the audit trail on actions in the system.
Storing and routing audit logs with Teleport
The Teleport cloud platform stores logs for 1 year and session recordings/cluster configurations indefinitely. Using on-prem, you have full control over the audit logs and how long they get retained. Using Teleport embedded RBAC controls, you can also tightly scope who gets access to view the audit logs, even creating auditor only roles that can view the audit logs but access nothing else. This allows you to provide granular visibility to logs without worrying about giving access to infrastructure. You can also export the logs to any SIEM system allowing you to centralize logs from your infrastructure to join logs coming in from other places in your organization. Using intermediate services like Fluentd, you can funnel your logs directly to those services in exactly the format you want them.
I hope this article provided a more in-depth look into the world of audit logging for cloud native organizations. If you’re interested in having audit logging without the overhead of building and maintaining it yourself, start a free trial of Teleport.
Frequently Asked Questions
What is audit logging?
Audit logging tracks and aggregates events that occur on a system. It focuses on recording details like what event transpired, who did the action, when they did it, and where these commands took place.
How is audit logging different from system logs?
System logs are primarily for debugging and offer insights into how a system operates, including error messages and application contexts. On the other hand, audit logs primarily track who accesses the system, what they do, and where. They are crucial for compliance and risk management.
What are some key details included in audit logs?
Typical log entries may contain UIDs, User Id, timestamps, IP addresses, activity details, changes to user privileges, authentication attempts, and more.