Table Of Contents
- Recap of Previous Posts
- The Vendor’s Perspective
- Let's look at some actual data!
- Valuation multiple of revenue
- Did either model help with a faster or more capital efficient path to IPO?
- Which model has lower costs of revenue / higher gross margins?
- Do Open Core companies lower their R&D costs through open source communities?
- Teleport cybersecurity blog posts and tech news
- Which model has more efficient sales and marketing?
- Conclusion
Home - Teleport Blog - SaaS vs Open Core: Which Business Model Is Best? - Jun 3, 2019
SaaS vs Open Core: Which Business Model Is Best?
Recap of Previous Posts
In the first post of this series we talked about how SaaS became the dominant model for delivering software and that there were signs that a new model may be emerging - commercial open source software (“COSS”), which is primarily monetized through an Open Core model of selling services and proprietary features around the open source software core. We also posited that for this new model to be successful, there must be some pent up demand for something other that the existing dominant delivery model (SaaS).
In the second post, we discussed how there is actually quite a bit of overlap between SaaS and Open Core and to draw a distinction, we would assume the Open Core software is primarily being delivered on-premises for comparison purposes. We then examined the advantages and disadvantages of purchasing SaaS vs. Open Core Software to try to evaluate if there could be enough demand for the Open Core model.
We came to the conclusion that the benefits of SaaS (from the customer's perspective) were mainly lowering the operational burden of running the software and lowering the upfront costs due to the fact that usage based billing is more prevalent with SaaS. The benefits of Open Core were mainly the ability of the customer to control its data and reduce the vendor lock-in due to the open source nature of a significant portion of the software.
The Vendor’s Perspective
The perspective of the other side of the market, the vendor, is also worth considering when determining if a new delivery model has potential. Are there any obvious business model advantages, like faster time to market, lower R&D costs or more efficient sales and marketing strategies?
Here are some theories:
- Open Core vendors have lower delivery costs (cost of revenue / COGS) since the software is primarily being delivered on-premises. In addition, they can leverage the community to lower their R&D costs through the community development of the software. Advantage Open Core
- SaaS vendors have a big advantage in that they have access to more data regarding the adoption and usage patterns of their solution, which enables faster iteration and more efficient sales and marketing strategies. A counterpoint is that Open Core vendors can more efficiently build a community of free users with an open source core and this creates more awareness for any open core commercial offering, leading to a more efficient sales and marketing process. I am skeptical of this second point. Advantage SaaS
- SaaS vendors have better customer retention because it is more difficult for the customer to leave a hosted solution. However, the IT investment in running on-premises software can also create some vendor lock-in for Open Core solutions. Close, let's call it a draw.
- Open Core vendors should not have to finance their businesses as much as SaaS because SaaS customers are more likely to pay a lower per usage price, initially. SaaS is a way for customers to finance the upfront purchase of software and the infrastructure to run it and pay that back over time. Advantage Open Core
| Vendor's Benefit | SaaS | Open Core |
|---|---|---|
| Lower Operational Burden | ||
| More Data Control | ||
| More Vendor Lock-In | ||
| Higher Initial Revenue |
Let's look at some actual data!
While these make some intuitive sense, the increased number of enterprise software companies that have recently IPO’d gives us the opportunity to further evaluate these theories by looking at actual business results.
In an effort to create an apples-to-apples comparison, I looked at financial data in the S-1 filings for both SaaS and Open Core enterprise software companies. Since there are fewer Open Core companies that have gone public recently I started with those companies and tried to find similar SaaS companies based on the year of IPO (2017-2019), annual revenue, valuation at the pricing of the IPO ($1-$3 billion) and the average customer value ($20-$200k) as a proxy for customer type.
I came up with the following list of companies:
| Company Name | Category | IPO Year | IPO Value | Annual Revenue | Avg Deal |
|---|---|---|---|---|---|
| Anaplan | SaaS | 2018 | $1.4B | $219MM | $193K |
| Okta | SaaS | 2017 | $1.5B | $160MM | $46K |
| Zuora | SaaS | 2018 | $1.4B | $168MM | $127K |
| Zscaler | SaaS | 2018 | $1.9B | $170MM | $61K |
| Cloudera | Open Core | 2017 | $1.9B | $261MM | $200K |
| Elastic | Open Core | 2018 | $2.5Bn | $227MM | $38K |
| MongoDB | Open Core | 2017 | $1.2B | $136MM | $29K |
| Mulesoft | Open Core | 2017 | $2.9B | $188MM | $143K |
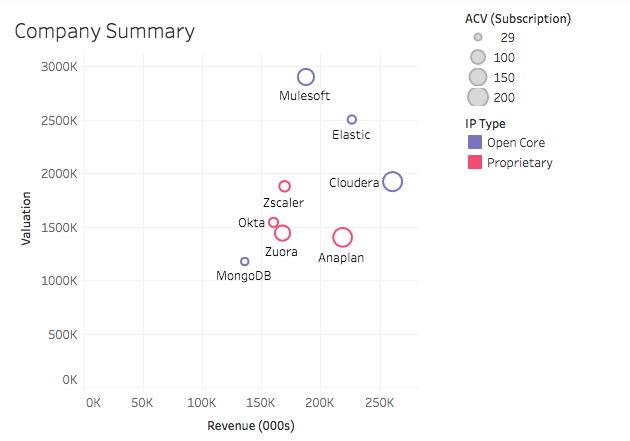

Not a great sample size but let’s forge ahead.
I limited my evaluation to the S-1 data, since it was easy to obtain and it helps to answer the question: did either model give startups an appreciable advantage in obtaining the holy grail of going public.
So let’s take a look at some basic metrics.
Valuation multiple of revenue
First let’s see if there is any differentiation by how the market values each type of company by looking at the IPO pricing valuation over twelve month trailing revenue (TTM).
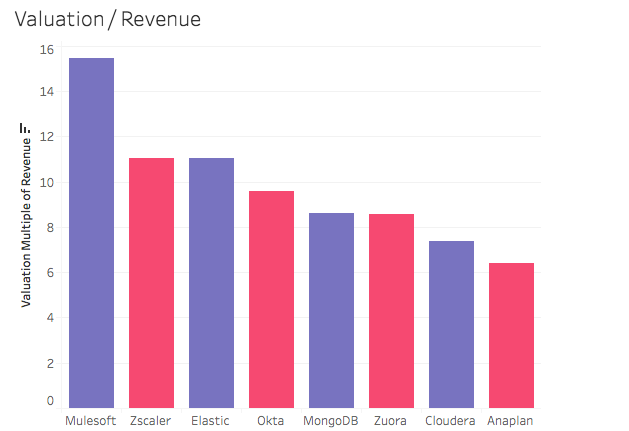

While Mulesoft is a standout, it is pretty clear by the alternating colors above that the market has no a priori preference for one business model over the other.
Did either model help with a faster or more capital efficient path to IPO?
One could measure the capital efficiency of a startup by the IPO valuation divided by the amount of money it raised to get there. This would help test our theory that Open Core vendors should not have to finance their businesses as much as SaaS.
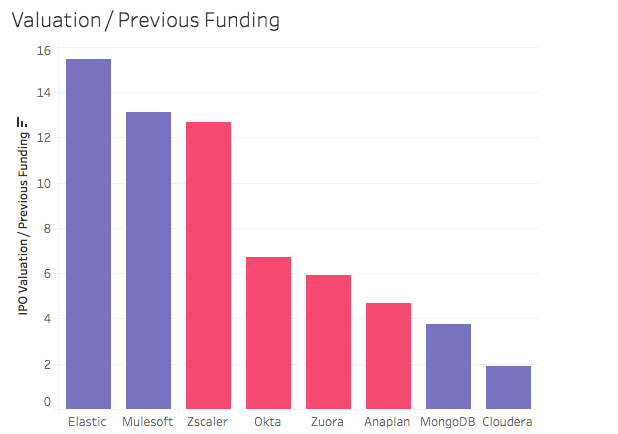

Elastic outperforms, with another Open Core company, Mulesoft in second. However the next four are all proprietary SaaS.
But perhaps a company raised more money than it needed or there was some subjectivity due to market sentiment at the time. Let’s just looking at the annual revenue divided by the accumulated deficit or the amount of money spent to get to a certain level of revenue.
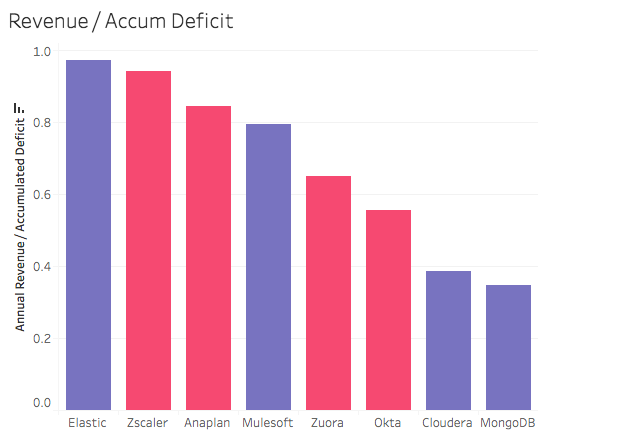

Now we see more dispersion with Mulesoft falling to the middle of the pack. There doesn’t seem to be any appreciable differentiation. Let’s dive further into the S-1 financials to see if they support our other theories.
Which model has lower costs of revenue / higher gross margins?
One theory above was that Open Core vendors would have lower cost of revenue since the software could be delivered on-premises.
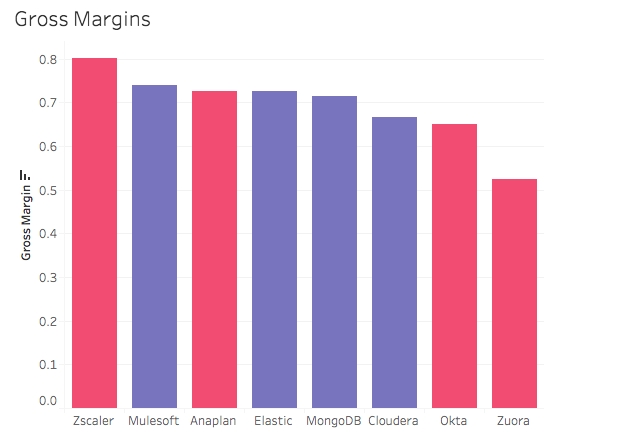

This doesn’t seem to support that with overwhelming evidence. However, this could be due to the fact that Open Core companies tend to have more services revenue which tends to have lower gross margin. Let’s look at just subscription or product related gross margin.
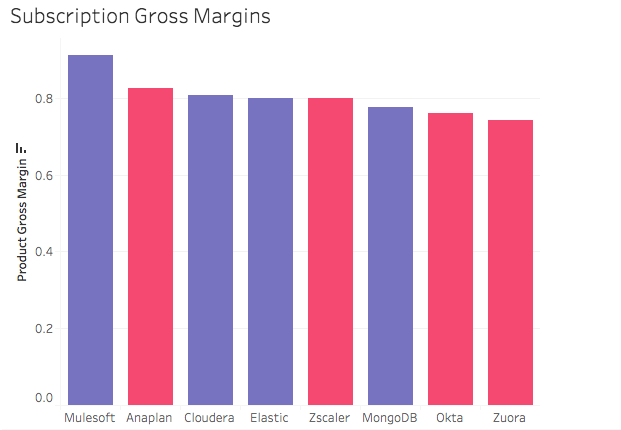

As expected, overall gross margins were higher and a couple Open Core companies moved up. This could be a clue into what an optimal model might be from the vendor perspective
- a self-serve delivery model (with minimal services) but running on customer infrastructure.
Do Open Core companies lower their R&D costs through open source communities?
We also hypothesized that Open Core companies can leverage the community to lower their R&D costs. Let’s look at R&D costs as a percentage of revenue:
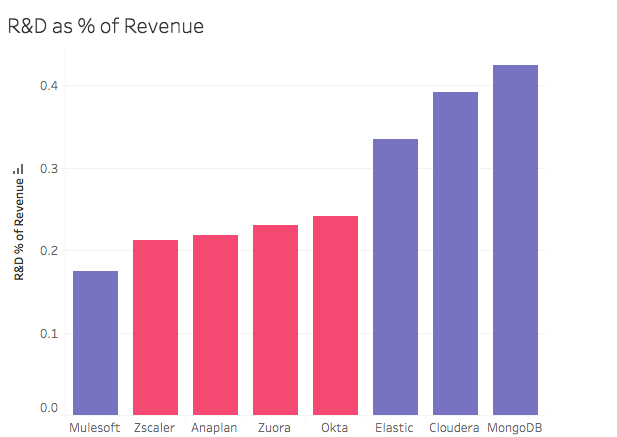

While Mulesoft has very low R&D costs as a percentage of revenue, the other Open Core companies do not, relative to the proprietary SaaS companies. I think we have debunked our theory that Open Core companies get appreciable “free R&D” from their communities.
Teleport cybersecurity blog posts and tech news
Every other week we'll send a newsletter with the latest cybersecurity news and Teleport updates.
Which model has more efficient sales and marketing?
A couple of other theories above: SaaS vendors have a big advantage in that they see more data around the adoption and usage patterns of their solution, enabling more rapid iteration and more efficient sales and marketing strategies. A counterpoint is that Open Core vendors can more efficiently build a community around their open source (aka, freemium) offerings.
Let’s see if there is any appreciable difference in sales and marketing efficiency. I used a metric of (Current Gross Profit - Previous Year Gross Profit) / (Current S&M Costs - Previous Year S&M Costs) to estimate sales and marketing efficiency. In other words, for each additional dollar of sales and marketing spend, how much did gross profit grow?
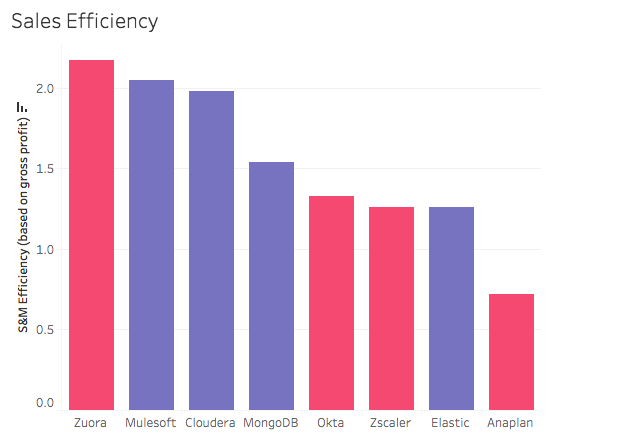

Zuora stands out, especially given they also had the lowest gross margins. The next three are Open Core companies but we can’t really determine if either model results in more efficient go-to-market strategies.
The other theory above was that SaaS companies can better optimize their sales processes due to the fact that they can more easily see customer usage. A common metric to measure this (along with customer loyalty) is customer expansion or net dollar expansion - how revenue is growing from existing customers.
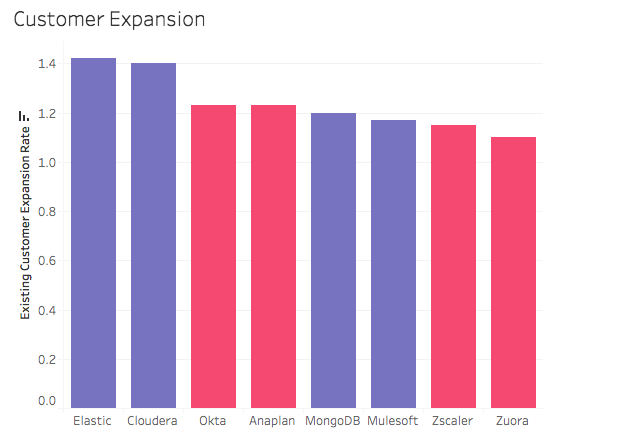

It appears that we can debunk this theory as well, with the two top companies being open core companies and the two bottom companies being proprietary SaaS.
Conclusion
The intention of this series was to explore SaaS vs Open Source from a go-to-market perspective to illustrate whether the Open Source model can succeed alongside the more dominant SaaS business model that has emerged over the last 10 years.
From looking at recent S-1 filings, there is not any obvious evidence that shows either model outperforms. Given the small sample size, we should probably be careful about coming to any conclusion, regardless. One safe conclusion seems to be that you can build a great business with either model.
We also saw some data that suggests if Open Core companies could limit the services component of their revenue or if SaaS companies could deliver their solution on-premises to lower their cost of revenue (i.e., hosting expenses), you could have the best of both worlds.
This hybrid model may become easier to deliver due to a couple of factors:
- The wide-spread adoption of cloud-native technologies like containers and Kubernetes; and
- The fact that “cloud is the new on-premises” for many enterprise buyers.
Software can be more easily deployed and managed on customers’ cloud / cloud-native infrastructure versus traditional on-premises data centers so they can still get a SaaS-like experience, while having more control of their data. You are starting to see more of this deployment model with recently IPO’d Open Core companies, like Elastic.
You can find the data underlying these charts in this Google Sheet. You can also find the charts on Tableau Public. We’ll try to update this data as new Open Core companies go public. Hopefully, for us Open Core startups out there, that trend continues :)
Tags
Teleport Newsletter
Stay up-to-date with the newest Teleport releases by subscribing to our monthly updates.

Subscribe to our newsletter

