Home - Teleport Blog - What is eBPF and How Does it Work?
What is eBPF and How Does it Work?

About a year ago, a friend of mine decided to build an EVM (Ethereum Virtual Machine) assembler in Rust. After some prodding from him, I began to help by writing unit tests. At the time, I knew very little about operating systems and started to read about lexical and symbolical analyzers. I was quickly in way over my head. What I did retain, however, was a newfound appreciation for the OS as a whole. So, when he started raving about eBPF, I knew I was in for a treat.
The bar for understanding what eBPF is and what it can do is high. Finding a good foothold to start was difficult for me. On the spectrum of basic 500-word mini-blogs to Cilium’s overwhelming documentation, material certainly skews towards documentation. My goal here is to provide a thorough entrypoint into this nascent technology, preparing you for progressively technical deep dives, like Linux Weekly News, Brendan Gregg’s website, and Cilium’s documentation. Together, we will explore:
- What eBPF does
- How eBPF works
- An example of eBPF in use
- How to start using eBPF
What Does eBPF Do?
eBPF lets programmers execute custom bytecode within the kernel without having to change the kernel or load kernel modules. Exciting? Maybe not yet. eBPF is closely intertwined with the Linux kernel. For context, let’s briefly review some fundamental concepts.
Linux divides its OS into two distinct areas: kernel space and user space. Kernel space is where the core of the operating system resides. It has full and unrestricted access to all hardware - memory, storage, CPU, etc. Due to the privileged nature of kernel access, the space is protected and allowed to run only the most trusted code. User space is where anything that is not a kernel process runs - I/O, file system manipulation, etc. These programs have limited access to hardware and must make syscalls through an API exposed by the kernel. In other words, user space programs must be filtered through the kernel space.
While the system call interface was sufficient in most cases, developers need more flexibility to add support for new hardware, filesystems, network protocols, or even custom system calls. There had to be a way for custom programs to access hardware directly, a way to extend the base kernel without adding directly to the kernel source code. Linux Kernel Modules (LKMs) serve this function. Unlike system calls, whereby requests traverse from the user space to kernel space, LKMs are loaded directly into the kernel, making them a part of it. Perhaps the most valuable feature of LKMs is that it can be loaded at runtime, removing the need to recompile the entire kernel and reboot the machine.
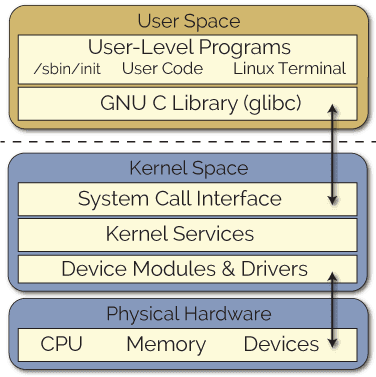

As helpful as LKMs are, they do introduce a lot of risk to the system. The division of kernel and user spaces added a number of security measures to the OS. The kernel space is meant to run only a privileged OS kernel. The layer between, connected by the system call interface, separated user space programs that could mess with finely tuned hardware. In other words, LKMs could certainly crash the kernel. Aside from the wide blast radius of security vulnerabilities, modules incur a large overhead maintenance cost in that kernel version upgrades could break the module.
What is eBPF
eBPF programs are a more recent invention for accessing services and hardware from the Linux kernel space. Already these programs have been used for networking, debugging, tracing, firewalls, and more.
Born out of a need for better Linux tracing tools, eBPF drew inspiration from dtrace, a dynamic tracing tool available primarily for Solaris and BSD operating systems. Unlike dtrace, Linux could not get a global overview of running systems, it was limited to specific frameworks for system calls, library calls, and functions. Building on the Berkeley Packet Filter (BPF), a tool for writing packer-filtering code using an in-kernel VM, a small group of engineers began to extend the BPF backend to provide a similar set of features as dtrace. First released in limited capacity in 2014 with Linux 3.18, making full use of eBPF requires at least Linux 4.4 or above.
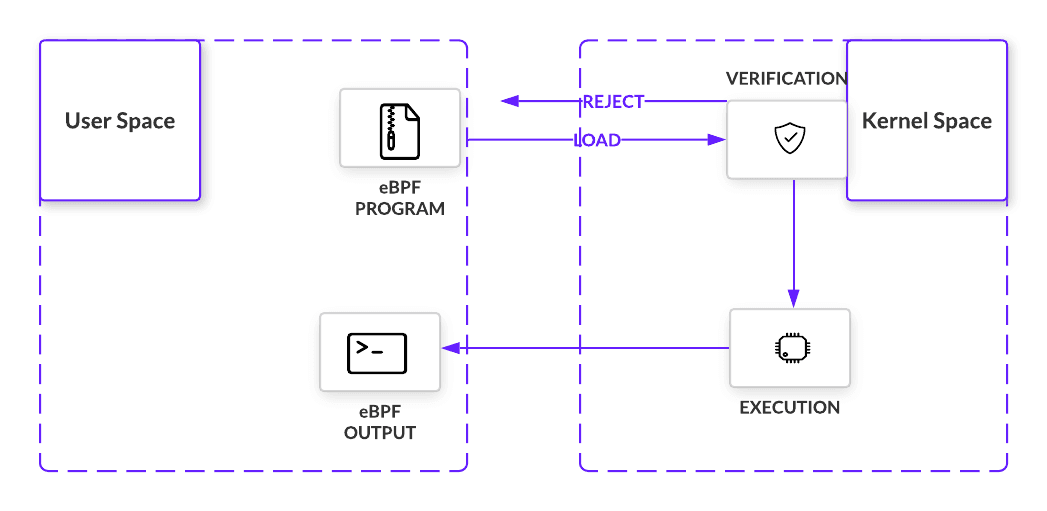

In Figure 2, we see a simplified visualization of eBPF architecture. Before being loaded into the kernel, the eBPF program must pass a certain set of requirements. Verification involves executing the eBPF program within the virtual machine. Doing so allows the verifier, with 10,000+ lines of code, to perform a series of checks. The verifier will traverse the potential paths the eBPF program may take when executed in the kernel, making sure the program does indeed run to completion without any looping that would cause a kernel lockup. Other checks, from valid register state, program size, to out of bound jumps, must also be met. Almost immediately, eBPF sets itself apart from LKMs with important safety controls in place.
If all checks are passed, the eBPFprogram is loaded and compiled into the kernel at a point in a code path and listens for the right signal. That signal comes in the form of an event that passes where the program is loaded in the code path. Once triggered, the bytecode executes and collects information as per its instructions.
So what does eBPF do? It lets programmers safely execute custom bytecode within the Linux kernel without modifying or adding to kernel source code. While still a far cry from replacing LKMs as a whole, eBPF programs introduce custom code to interact with protected hardware resources with minimal threat to the kernel.
How eBPF Works
So far, I’ve reduced eBPF to its bare architecture. But, there are more components working together, each of which has layers of complexity of their own.
Anatomy of an eBPF Program
Events and Hooking
eBPF programs are triggered by events that pass a particular location in the kernel. These events are captured at hooks when a specific set of instructions are executed in a single run. When triggered, these hooks will execute an eBPF program, letting us capture or manipulate data. The diversity of hook locations is one of the many aspects that makes eBPF so useful. A quick sampling of these locations include:
- System Calls - Inserted when user space functions transfer execution to the kernel
- Function Entry and Exit - Intercepts calls to pre-existing functions
- Network Events - Executes when packets are received
- Kprobes and uprobes - Attach to probes for kernel or user functions
Helper Calls
When eBPF programs are triggered at their hook points, they make calls to helper functions. These special functions are what makes eBPF feature-rich in accessing memory. For example, helpers can perform a wide variety of tasks:
- Search, update, and delete key-value pairs in tables
- Generate a pseudo-random number
- Collect and flag tunnel metadata
- Chain eBPF programs together, known as tail calls
- Perform tasks with sockets, like binding, retrieve cookies, redirect packets, etc.
These helper functions must be defined by the kernel, meaning there is a whitelist of calls eBPF programs can make. But the number is large and continues to grow.
Maps
To store and share data between the program and kernel or user spaces, eBPF makes use of maps. As implied by the name, maps are key-value pairs. Supporting a number of different data structures, like hash tables, arrays, and tries, programs are able to send and receive data in maps using helper functions.
Executing an eBPF Program
Loading and Verifying
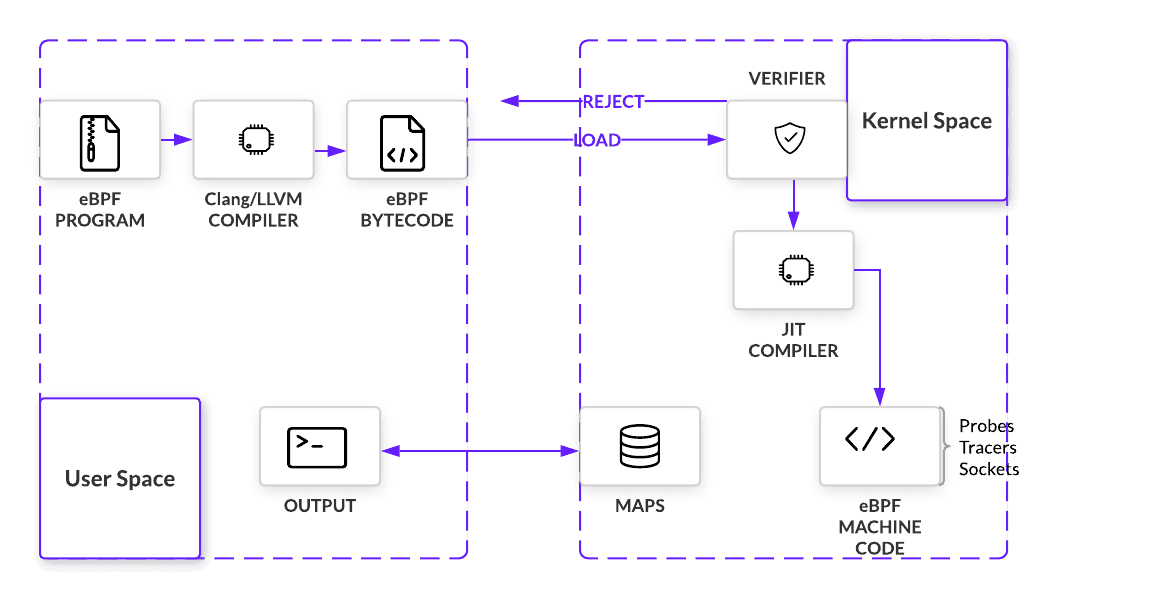
The kernel expects all eBPF programs to be loaded as bytecode, so unless bytecode is being written, we need a way to compile higher level languages. To build out this compiler, eBPF uses LLVM as its back-end infrastructure on which a front-end for any programming language can be built. Because eBPF programs are written in C, that language front end is Clang. But before compiled bytecode can be hooked anywhere, it must pass a series of checks. By simulating the program in a VM-like construct, an in-kernel verifier can prevent programs that loop, do not have the right permissions, or crash the kernel. If the program passes all checks, program bytecode will be loaded onto the hook point using a bpf() system call
Just-In-Time (JIT) Compiler
After verification, eBPF bytecode is JIT’d into native machine code. eBPF has a modern design, meaning it has been upgraded to be 64-bit encoded with 11 total registers. This closely maps eBPF to hardware for x86_64, ARM, and arm64 architecture, amongst others. Fast compilation at runtime makes it possible for eBPF to remain performant even as it must first pass through a VM.

Summary
Putting this conceptual jigsaw together, eBPF programs are inserted into a hook point after passing a number of safety checks. When they are triggered by an event, programs execute immediately, using a combination of helper functions and maps to manipulate and store data. We’ll take a closer look at how these components work together in the next section
Example: eBPF in Action
At Teleport, we’ve used a few eBPF programs in one of our open source projects, Teleport, for tracing and networking. For some necessary context: Teleport gives developers secure server access via SSH. Because organizations want to know what happens during a session, Teleport records user actions. Yet there are ways to bypass session recording entirely by obfuscating behavior within encoded commands, commands run in shell scripts, or even terminal commands like disabling echo.
Earlier this year with our Teleport 4.2 release, we introduced enhanced session recording, which uses three eBPF programs (for now!) to take unstructured SSH sessions and transform them into a stream of structured events.
Consider echo Y3VybCBodHRwOi8vd3d3LmV4YW1wbGUuY29tCg== | base64 --decode | sh. Though we can capture this command printed in the terminal, it means nothing to us as the user has encoded something to obfuscate their actions. But using eBPF, we learn the user is was attempting to obfuscate curl:
{
  "event": "session.command",
  "path": "/bin/sh",
  "program": "sh",
  "argv": [],
  "login": "centos",
  "user": "jsmith"
}
{
  "event": "session.command",
  "path": "/bin/base64",
  "program": "base64",
  "argv": [
    "--decode"
  ],
  "login": "centos",
  "user": "jsmith"
}
{
  "event": "session.command",
  "path": "/bin/curl",
    "argv": [
    "http://www.example.com"
  ],
  "program": "curl",
  "return_code": 0,
  "login": "centos",
  "user": "jsmith"
}
{
  "event": "session.network",
  "program": "curl",
  "src_addr": "172.31.43.104",
  "dst_addr": "93.184.216.34",
  "dst_port": 80,
  "login": "centos",
  "user": "jsmith",
  "version": 4
}
In such a case, we can use eBPF to monitor and turn it into a stream of events that can be exported for analysis. Specifically, Teleport used execsnoop, opensnoop, and tcpconnect to uncover these events. We’ll focus on tcpconnect, which gives us the information in final JSON object.
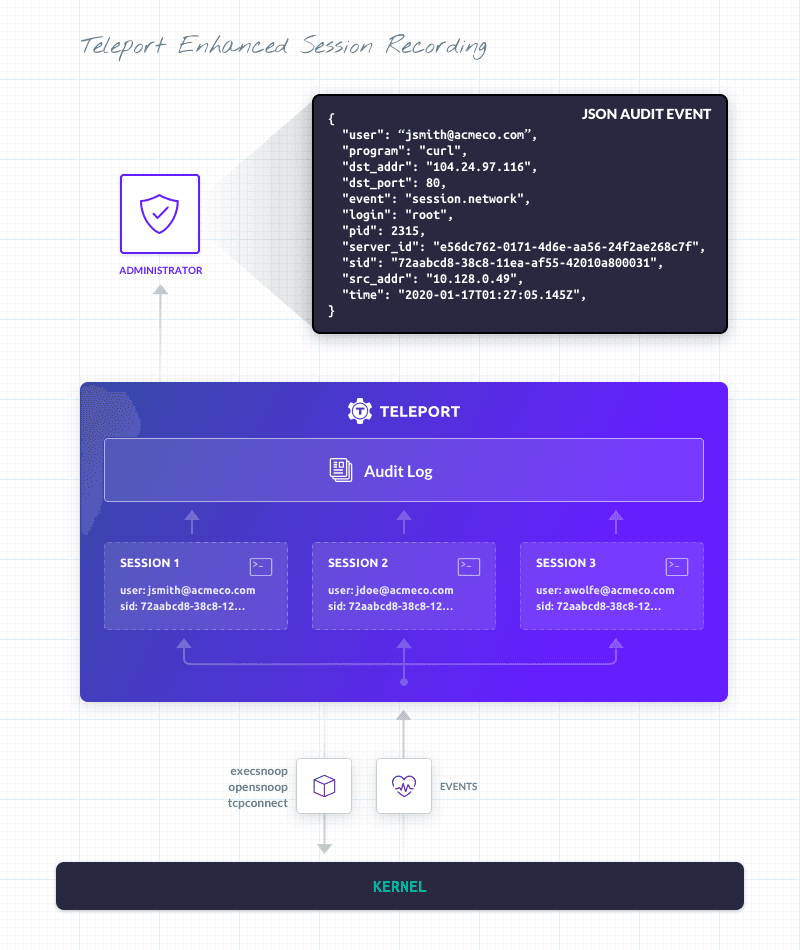

tcpconnect traces TCP connections. For a tool like Teleport that manages access using SSH certificates, knowing when TCP connections are made is vital. tcpconnect can be used to trace the connect() syscall, which initiates a connection on a socket. To trace these entries, tcpconnect inserts a kprobe into the kernel to dynamically break into any routine
# initialize
BPF b = BPF(text=bpf_text) b.attach_kprobe(event="tcp_v4_connect", fn_name="trace_connect_entry") b.attach_kretprobe(event="tcp_v4_connect", fn_name="trace_connect_v4_return")
When the program is triggered along the code path, tcpconnect will start outputting information. The table below samples some of this information.
# ./tcpconnect
PID   COMM  SADDR             DADDR           DPORT
-----------------------------------------------------
2315  curl  172.31.43.104     93.184.216.34   80
All this data has been collected using helper functions. In fact, when we look at the (python) code, we can see tcpconnect using helper functions from the bcc’s BPF library to format the information outputted above.
...
struct ipv4_data_t data4 = {.pid = pid, .ip = ipver};
data4.saddr = skp->__sk_common.skc_rcv_saddr;
data4.daddr = skp->__sk_common.skc_daddr;
data4.dport = ntohs(dport);
bpf_get_current_comm(&data4.task, sizeof(data4.task));
...
Teleport cybersecurity blog posts and tech news
Every other week we'll send a newsletter with the latest cybersecurity news and Teleport updates.
Starting with eBPF
If you’ve made it to this point, my hope is you’ve attained at least a baseline understanding of what eBPF is, why it’s important, and the basics of how it works. Now would be a good time to explore more technical documentation and articles, referencing this post if you start to get lost in the minutia. Towards the beginning, I linked a few resources, but the most exhaustive accumulation of resources I’ve seen so far has to be Quinten Monnet’s blog, Whirl Offload.
Moving onto the code itself, writing your own eBPF programs can be quite a challenge. But over time, several open-source development toolchains have been built for the various use cases eBPF unlocks. Some of the most popular tools include:
- BCC - “BCC is a toolkit for creating efficient kernel tracing and manipulation programs, and includes several useful tools and examples...BCC makes BPF programs easier to write, with kernel instrumentation in C (and includes a C wrapper around LLVM), and front-ends in Python and lua. It is suited for many tasks, including performance analysis and network traffic control.” BCC also provides an API for other programs to use.
- bpftrace - “BPFtrace is a high-level tracing language… [that] uses LLVM as a backend to compile scripts to BPF-bytecode and makes use of BCC for interacting with the Linux BPF system, as well as existing Linux tracing capabilities: kernel dynamic tracing (kprobes), user-level dynamic tracing (uprobes), and tracepoints.”
- Generic libraries for Go, C/C++, and Rust
Conclusion
eBPF is a relatively new technology that lets programmers execute custom bytecode within the kernel and extract much more data from kernel functions without the complications of modifying kernel space. This can be done using system calls or loading kernel modules, but eBPF achieves the same outcomes without the complexity or insecurity that would otherwise be introduced. Summarizing, eBPF works by:
- Compiling eBPF programs into bytecode
- Verifying programs execute safely in a VM before being loaded at the hook point
- Attaching programs to hook points within the kernel that are triggered by specified events
- Compiling at runtime for maximum efficiency
- Calling helper functions to manipulate data when a program is triggered
- Using key-value pairs to share data between the user space and kernel space
The important takeaway is understanding that eBPF unlocks access to kernel level events without the typical restrictions found when changing kernel code directly.
Table Of Contents
Teleport Newsletter
Stay up-to-date with the newest Teleport releases by subscribing to our monthly updates.
Tags

Subscribe to our newsletter

