Monitoring Kubernetes in Production
Introduction
In this blog post, we share some of the real-world problems we’ve encountered while deploying Kubernetes clusters on various infrastructure options, including Amazon Web Services (AWS) and bare metal Linux machines. We also share a solution that we developed to solve some of these problems, which we are open sourcing.
Important Disclaimer
Some folks have suggested that Kubernetes itself has robust monitoring features. That's true. But the built-in monitoring concerns itself with making sure your applications are being monitored.
While our focus is to keep Kubernetes itself healthy. The immediate use case is making sure that Kubernetes is up and running smoothly after being automatically upgraded to the new version.
Monitoring Kubernetes components
Monitoring Kubernetes cluster is not a trivial task and requires an equally non-trivial approach. To illustrate the types of failures that can occur, here’s an example from one of our AWS deployments.
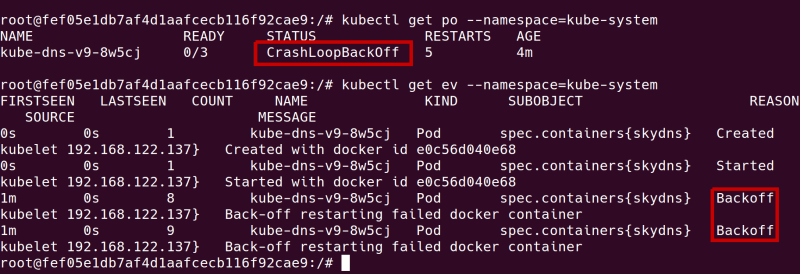
One of our clusters was showing perfectly healthy status, with SkyDNS working and all pods started. However, after several minutes, SkyDNS went into CrashLoopBackoff state. Application containers were up but dysfunctional, as they could not reach the database after the first restart. It turned out that the cluster was down but we could not get a clear understanding of what happened by looking at events and pods statuses:
After connecting to the master node and looking at the SkyDNS pod's logs, they revealed a problem with etcd. SkyDNS was not able to connect or the connection became unstable shortly after it had been established. etcd itself appeared running, so what was the problem? After quite a bit of investigating, we found the answer. High latency on network attached disks led to read and write failures so etcd was unable to write to the file system. Although it was properly configured and appeared to be working, it was not consistently available as a Kubernetes Service.
Lesson learned - even if you've successfully set up the cluster, there's no guarantee it will continue working as expected. What can go wrong during and after deployment? It pretty much follows Murphy’s Law.
- No connectivity between hosts
- etcd is down or is unstable/lagging due to misconfiguration
- Overlay network layer between the hosts is broken
- Any of the individual nodes are down
- Kubernetes API server or controller-manager is down
- Docker is unable to run containers
- Network partition that affects a subset of nodes
We exchanged a couple of ideas with the attendees of the first KubeCon to brainstorm about the possible solution:
How do you measure Kubernetes cluster health? @klizhentas's suggestion was an app that schedules pods and unschedules; anyone building this?
— Brandon Philips (@BrandonPhilips) November 11, 2015
We evaluated a few options for monitoring in the context of Kubernetes:
- Traditional monitoring agents
- Alternative approaches like custom application-specific smoke testing
Classic monitoring solutions
There's no shortage of traditional monitoring solutions. One of the best options in this category is monit.
It is a lean, extremely small (single executable) and battle-tested process daemon running on thousands of machines - perfect for small setups but is usually limited to monitoring a single system. This is its biggest disadvantage.
One of the problems we found with using monit is a limited set of performed tests and a lack of extensibility. Although configurable, we had to extend its functionality via writing scripts or special-purpose applications controlled via a weak interface.
More importantly, we found it very hard to connect several monit instances into a coherent, highly available and resilient network of agents with each collecting its own share of information and collaborating to keep this information up to date.
Smoke-style testing
The term smoke test is defined as:
A suite of preliminary tests to reveal simple failures severe enough to reject a prospective software release. It usually encompasses a subset of tests covering the most important functionality to ascertain that the crucial functions are working as expected. Frequent characteristic of a smoke-test is that it runs quickly, often on the order of seconds.
With our knowledge of Kubernetes, we believed we could use smoke testing to build a monitoring system with following features:
- Lightweight periodic testing
- High availability and resilience to network partitions
- No single point of failure
- History of health data as a time series
Regardless of the abstraction level where failures occur, be it an application failure or a low-level networking failure, this system would be able to trace them back to the actual cause.
Serf-powered monitoring agents
Our high-level solution is a mesh of agent processes with one residing on each node in a cluster. They communicate over a gossip protocol provided by serf:
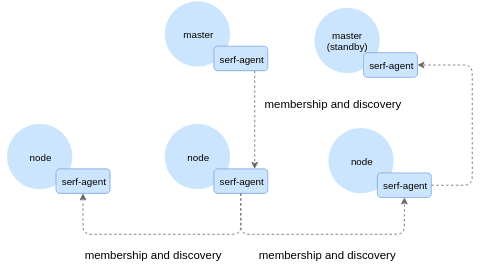
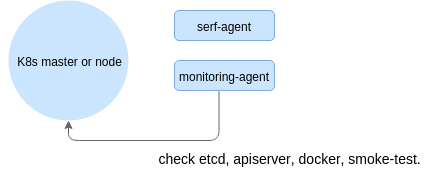
Agents monitor state of key Kubernetes components - etcd, scheduler, api server and others and execute smoke tests - spinning up lightweight containers that talk to each other.
Agents periodically sync the data so that each node possesses (almost) up to date information about the status of the cluster as a whole. It is not strictly up to date due to the weak consistency guarantees provided by Serf. The test results are periodically persisted to a back-end - this can be as simple as an SQLite database or a real time series database like InfluxDB.
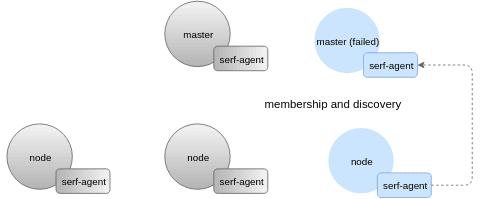
Having a peer-to-peer system is very helpful to detect failures and get monitoring information even if some of the critical parts are down. In the example below, master and most of the nodes are down which leads to etcd failure, as well. However, we can still get diagnostic information about the cluster connecting to any of the remaining nodes:
Here’s a snapshot taken on a degraded system:
{
  "status": "degraded",
  "nodes": [
    {
      "name": "4b12cd8050864a858c4b5f94f296a287.example.com",
      "member_status": {
        "name": "4b12cd8050864a858c4b5f94f296a287.example.com",
        "addr": "192.168.122.176:7496",
        "status": "alive",
        "tags": {
          "publicip": "192.168.122.176",
          "role": "master"
        }
      },
      "status": "degraded",
      "probes": [
        {
          "checker": "docker",
          "status": "failed",
          "error": "[healthz.go:29]  healthz check failed: Get http://docker/version: dial unix /var/run/docker.sock: connect: no such file or directory"
        },
        {
          "checker": "docker-registry",
          "status": "failed",
          "error": "[healthz.go:29]  healthz check failed: Get http://127.0.0.1:5000/v2/: dial tcp 127.0.0.1:5000: getsockopt: connection refused"
        },
        {
          "checker": "etcd-healthz",
          "status": "running"
        },
        {
          "checker": "systemd",
          "detail": "registry.service",
          "status": "failed",
          "error": "[systemd.go:96]  failed"
        }
      ]
    }
  ],
  "timestamp": "2016-02-26T19:01:52.75871448Z"
}
Teleport cybersecurity blog posts and tech news
Every other week we'll send a newsletter with the latest cybersecurity news and Teleport updates.
Limitations
Due to its simplicity, the current model has certain limitations. It works well for smaller clusters (e.g. 8 nodes), however, in a bigger cluster you wouldn’t want every node to talk to each other. The solution for this that we plan to adopt is to create special aggregators borrowing some ideas from Skype’s supernodes or Consul’s [anti-entropy catalogs].
Conclusion
Monitoring the state of a Kubernetes cluster is not straightforward using traditional monitoring tools. Having an automatic feedback loop inside the cluster is enormously helpful at eliminating much of the complexity related to manual troubleshooting.
The satellite project has already proven helpful for us when operating clusters, so we’ve decided to open source it. We hope it can be a point of collaboration for rolling a great Kubernetes failure detection system. Check it out in our github repository - pull requests are welcome!
Table Of Contents
Teleport Newsletter
Stay up-to-date with the newest Teleport releases by subscribing to our monthly updates.
Tags
Tags
Teleport Newsletter
Stay up-to-date with the newest Teleport releases by subscribing to our monthly updates.