Home - Teleport Blog - Aggregating SSH logs into SumoLogic
Aggregating SSH logs into SumoLogic
This tutorial is for Linux administrators who want to collect the SSH security events (SSH sessions, authentication attempts and so on) from their servers into a centralized location. The benefits of doing this are:
- Easily search for "who did what and when?"
- Configure alerts to go off when something bad happens.
This tutorial uses SumoLogic for storing and searching the aggregated logs and our SSH Access Solution called Teleport. One of the benefits of Teleport is that, unlike standard SSH logs providing only OS logins and client IPs, Teleport also knows and keeps track of the identity of a user and can integrate into popular identity providers and tools.
Overview
Teleport aggregates all events from all machines and stores them on its "auth server" by default. All that is left to do is to export them into SumoLogic.
Here's an overview of the steps we are going to take:


- We are going to set up the Sumo Logic Docker collector to export events and send them to Teleport
- We will set up a dashboard in SumoLogic to view SSH access logs into the cluster.
Events Overview
Every Teleport SSH Node and Proxy emits events in structured format. By default all events are shipped to the Teleport Auth server which stores them in the data directory:
/var/lib/teleport/log
├── 2016-12-31.00:00:00.log
└── sessions
    └── default
        ├── 0f4bd2e7-cf08-11e6-8f5c-507b9dd95841.session.bytes
        ├── 0f4bd2e7-cf08-11e6-8f5c-507b9dd95841.session.log
        ├── 3f80b949-cf08-11e6-8f5c-507b9dd95841.session.bytes
        ├── 3f80b949-cf08-11e6-8f5c-507b9dd95841.session.log
        ├── 9e47c67c-cf06-11e6-abba-507b9dd95841.session.bytes
        ├── 9e47c67c-cf06-11e6-abba-507b9dd95841.session.log
        ├── ab5e4493-cf08-11e6-9fd8-507b9dd95841.session.bytes
        └── ab5e4493-cf08-11e6-9fd8-507b9dd95841.session.log
Each day's logs is stored in the data folder log with a file name like 2016-12-31.00:00:00.log:
{"event":"session.start", ...}
{"event":"session.leave", ...}
Files are rotated automatically by the logger.
As you can see, there are multiple types of events. Every event is a JSON dictionary and events are delimited with newlines.
Here are the most important events:
Session Start and End
Session join session.start means that someone has just joined existing session
or created a new session.
{
  "event": "session.start",      // event name
  "addr.local":"127.0.0.1:3022", // the IP address of the SSH node
  "addr.remote":"10.0.5.1"       // IP address of the connecting client
  "login": "root",               // Linux OS login used by the Teleport user
  "user":"alice",                // User name (mapped to your identity store, i.e. LDAP, Github, Google, etc)
  "server_id":"bd73654f-f0ce-454b-b416-9519716e8818", // SSH server ID
  "sid":"9e47c67c-cf06-11e6-abba-507b9dd95841",       // unique SSH session ID
  "time":"2016-12-31T03:10:02Z"  // time of the event
}
session.end event means the session created by a user has just ended. This happens when
an SSH client disconnects.
{
   "event":"session.end",                         // event name
   "sid":"ab5e4493-cf08-11e6-9fd8-507b9dd95841",  // session ID, so you can pair start-end events
   "time":"2016-12-31T03:24:43Z",
   "user":"bob"
}
Auth Attempts
Another important event is the authentication attempt, i.e. auth. These events
can be especially useful when troubleshooting SSH configuration.
{
  "event": "auth",  // event name
  "success": false, // auth was unsuccessful
  "user": "bob",    // attempt was for Teleport user Bob
  "error": "bad username or password" // error details
}
Step 1. Set up Sumo Logic
Getting API Key
First, let's create a new Access key in the Sumo Logic interface:
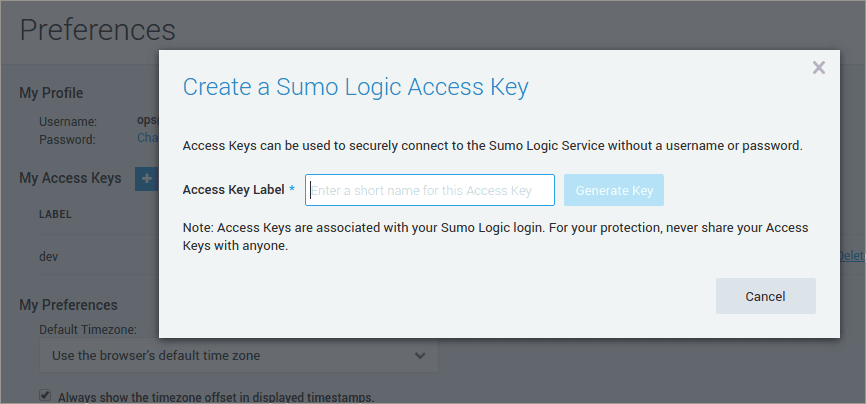

I've also exported my keys to environment variables to simplify integration with the data collector.
$ export SUMO_ACCESS_ID="<short access ID>"
$ export SUMO_ACCESS_KEY="<long access key>"
Start Docker Collector
Assuming our Teleport logs are in the directory /var/lib/teleport/log, we are going to set up sumo logic source using sumo-sources.json
and place it in /var/lib/teleport:
{
  "api.version": "v1",
  "sources": [
    {
      "sourceType": "LocalFile",
      "name": "localfile-collector-container",
      "pathExpression": "/var/lib/teleport/log/*.log",
      "category": "teleport/audit"
    }
  ]
}
Now, let's start the Sumo Logic data collector using Docker:
$ docker run -d \
  -e SUMO_ACCESS_ID=$SUMO_ACCESS_ID \
  -e SUMO_ACCESS_KEY=$SUMO_ACCESS_KEY \
  -e SUMO_SOURCES_JSON=/sumo/sources.json \
  -v /var/lib/teleport/log:/var/lib/teleport/log \
  -v /var/lib/teleport/sumo-sources.json:/sumo/sources.json \
  sumologic/collector:latest-file
Here are couple of notes about this command:
- We are using the official Docker image for Sumo Logic file collector
sumologic/collector:latest-file - We are passing access keys via environment variables
- We have mounted file
sumo-sources.jsonwith file sources into containers directory/sumousing command option-v /var/lib/teleport/log:/tmp/clogs - We have mounted teleport's log directory
/var/lib/teleportinto similar container's directory using command-v /var/lib/teleport/sumo-sources.json:/sumo/sources.json
Teleport cybersecurity blog posts and tech news
Every other week we'll send a newsletter with the latest cybersecurity news and Teleport updates.
Step 2: Check events and dashboard
Now, we can make sure your collector has registered:


Then we can filter all audit events by category teleport/audit:
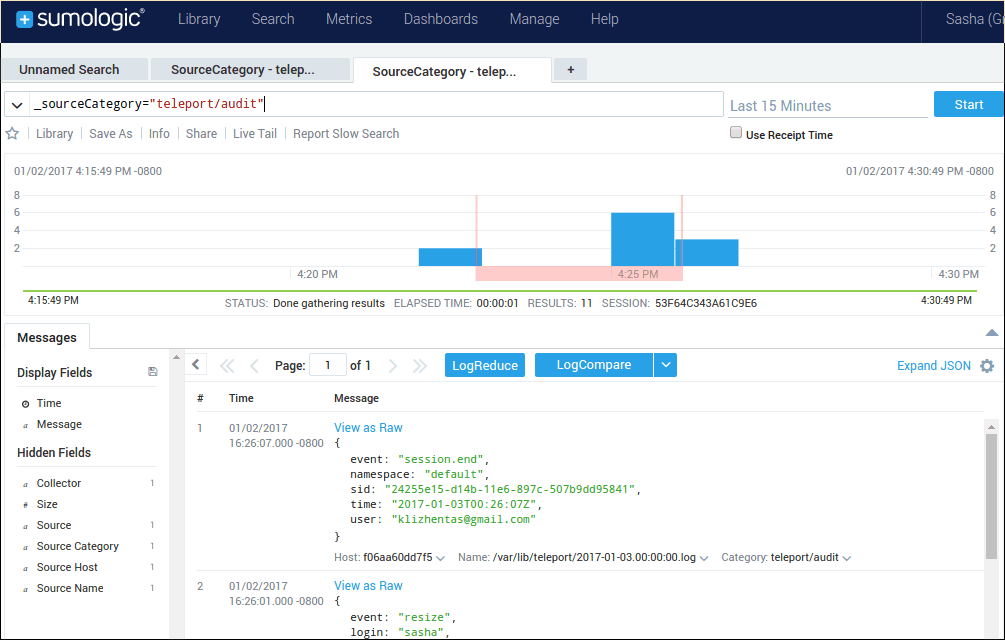

And that's it!
Now you can use Sumo Logic to easily find and view important information about the SSH sessions occurring on your infrastructure.
Additional Reading: How to SSH into Docker Container
Table Of Contents
Teleport Newsletter
Stay up-to-date with the newest Teleport releases by subscribing to our monthly updates.
Tags

Subscribe to our newsletter

